|

"The Figures of Population" article from the Gazette and Courier newspaper

"Growth and Future of the Nation" article from the Gazette and Courier newspaper
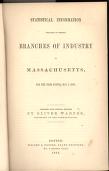
"Statistical Information Relating to Certain Branches of Industry in Massachusetts, For the
Year Ending May 1, 1865"
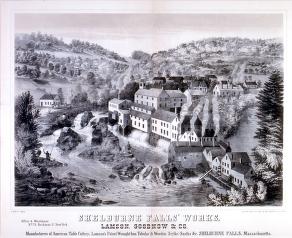
Lamson, Goodnow and Company, Birds-Eye View
|
Summary and Objective
Students will understand that census data can be used in the study of history. Students will understand that dramatic changes in industrialization took place towns in Franklin County over a period of 90 years. Students will understand that mathematical data can be plotted in line graphs and that these graphs can be used to analyze trends and develop hypothesis regarding history.
Teaching Plan
Step 1.
Discuss Franklin County and local towns familiar to the students. Ask them to describe the towns along the concept of industrial/agricultural development. Write a brief description of the towns as would be seen in a brochure describing the town(s).
Step 2.
Use the Website city-data.com to find the 2007 population for the cities of Franklin County in these groupings
1. Greenfield, Montague and Orange
2. Buckland, Conway, Colrain, Gill, Shelburne, and Erving
3. Northfield, Ashfield, Sunderland, Whately, Bernardston and Charlemont Students can work in small groups to find
the data. Once the data for each town is found, the students will add the figures together to get a population total for each group.
Step 3.
Once the data is totaled for each group, students will create a line graph titled Population Changes in Smalls Towns in Franklin County, MA. Each group will have its own line graph with a time scale of 1890, 1895,1900 and 2007.
Step 4.
For each group, determine the range tween 1900 and 2007. Discuss from this data if there has been an increase or decrease or both of population in each of the groups. Look for any trends in the data.
Step 5.
Now, read the census data as presented in Branches of Industry in Massachusetts, for the Year Ending May 1, 1865. Teacher should have prepared a copy of pages from this site for each of the towns in Group 1,2, and 3. The site is extensive but easily navigated. Students will read the data, noting manufacturing and agricultural endeavors for each town in Group 1,2,3. Students will create a list of industries for each group. Afterwards, students may enjoy looking at the picture of Lamson, Goodnow and Company, Birds-Eye View.
Step 6.
Using historical census data from the University of Virginia, find the data for Annual Value of Products in Manufacturing for Franklin County. Print the data for the students to examine. Create a new line graph showing the Annual value for each decade of 1850-1940 in Franklin County.
Step 7.
Using University of Virginia website and the line graph created in step 5, plot a new line to the line graph for the Total Population line for Franklin County. This line will be of a new color so that a comparison can be made between population changes and changes in Annual Value of Products in Manufacturing for Franklin County. Plot the data from 1850 to 1940. Students will notice an increasing population and a dramatic decline of industrial production. This should be good fodder for discussion about human impact of these changes.
Step 8.
Given the line graph created in Step 3, 5 &6 and the data presented in Step 5, students will discuss the prediction of manufacturing in New England presented "Growth and Future of the Nation." Students may wish to discuss other reasons for the decline and fall of industrialization in New England and Franklin County.
|


